
In this article
A research presentation should make the question, method, finding and limitation distinguishable. The audience needs to know what the evidence supports before considering a recommendation.
The interview-study example in this guide is fictional and illustrates qualitative reporting, not an actual study or a population estimate. The separate Syaxis example below is a real generated deck, with its source checks and revisions disclosed.
What to take away.
Match the strength of the claim to the method.
Keep quotations, counts and interpretations distinct.
Put the limitation beside the finding it qualifies.
A real Syaxis research-to-presentation example
Input: A topic and an audience of business leaders, with no uploaded files or prescribed studies. We selected an eight-slide broad overview in the setup questions.
Exact brief: “Research where AI helps people at work and create a presentation for business leaders. An energetic science-magazine style with a couple of evidence-led visuals would work well.”
Result: “Where AI helps people at work,” a complete briefing drawing on four studies across professional writing, customer support and software development. Syaxis selected the research, developed the argument and designed the slides. The deck keeps task completion time, assessed writing quality and issues resolved per hour distinct.
The findings describe each study’s own setting, not Syaxis customer outcomes or a universal productivity gain. This is a selected, reviewed and revised demonstration.
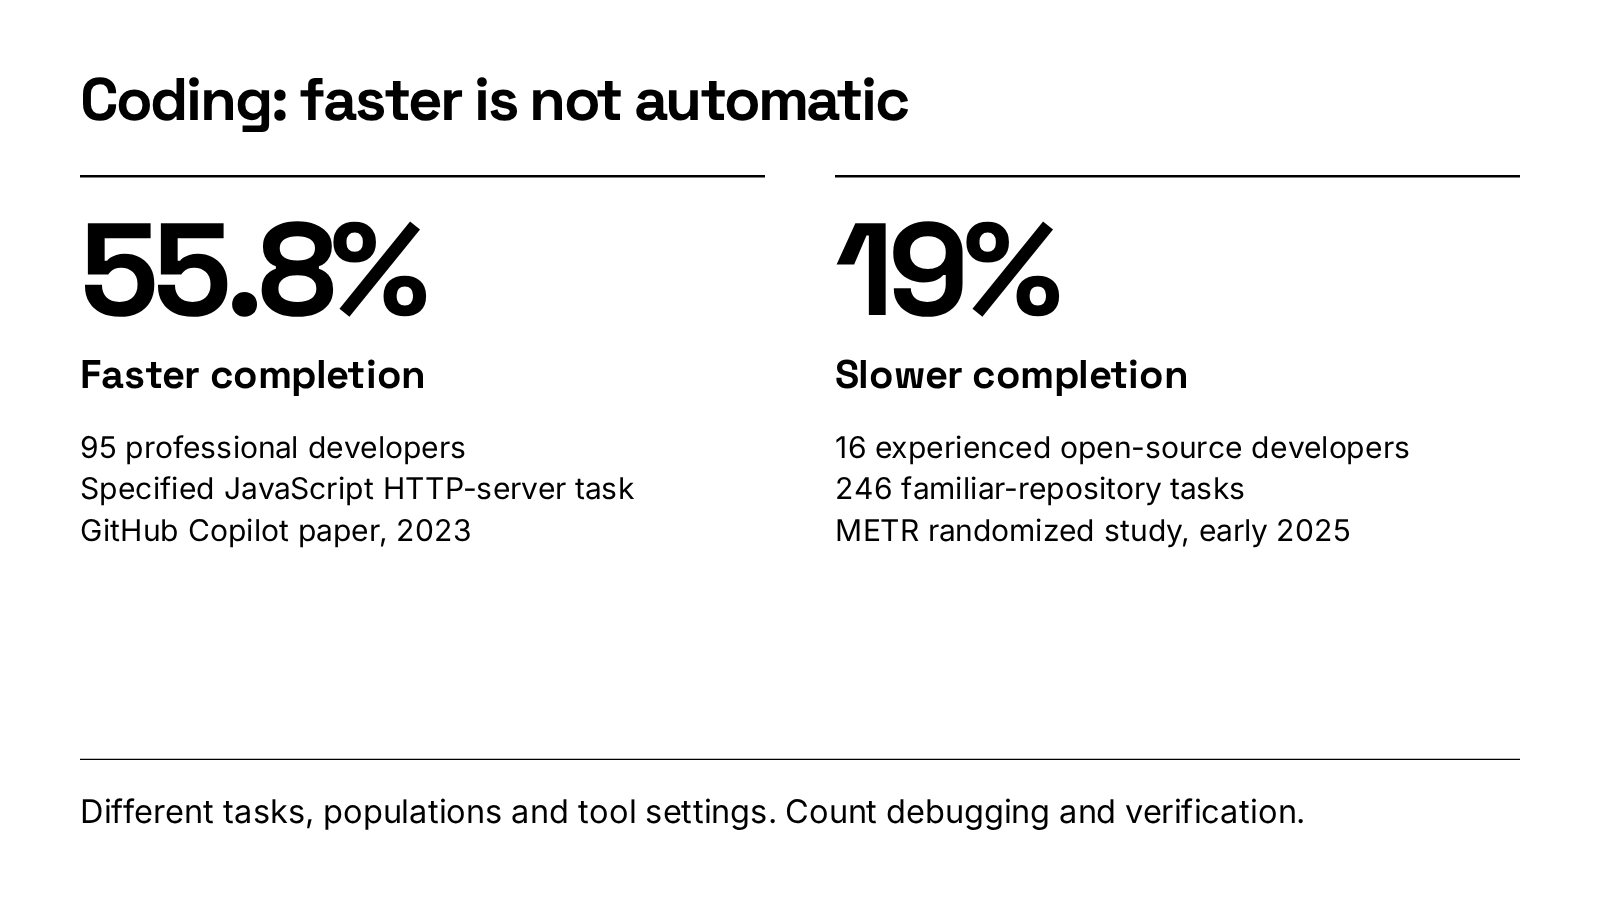
- Download the eight-slide PDF or PowerPoint. The PPTX includes editable text and shapes alongside images; its charts and tables are not native editable objects.
- Create a presentation from your question. No source packet or prepared outline is required.
- How this example was made and checked.
Turn Research into a Presentation
“Research onboarding” is open-ended. “What should we investigate before piloting a new onboarding checklist?” gives the work a boundary. List the audience, current decision, relevant period and information already available.
Identify the type of evidence needed. A product comparison may require current vendor documentation. A research finding may require the original study. A business recommendation may depend on internal records that public search cannot supply.
An eight-slide research presentation
The question in this example is where new users experience confusion during setup. Six interviews can reveal useful experiences, but they cannot establish the prevalence of every problem in the wider population.
A quantitative experiment needs different detail: measures, sample, comparison groups and uncertainty around the result. A literature review needs the scope of the search and criteria for inclusion. Keep the question-method-finding relationship while changing the evidence slide to fit the actual study.
| Slide | Purpose | Example content |
|---|---|---|
| 1 | Research question | Where do new users lose confidence during setup? |
| 2 | Context | The setup process and why the question matters |
| 3 | Method | Six interviews, recruitment approach and interview period |
| 4 | Finding A | Participants described uncertainty about the next step |
| 5 | Finding B | Terminology created different interpretations |
| 6 | Variation | An experience that did not fit the main pattern |
| 7 | Implication | Prototype clearer next-step guidance |
| 8 | Limitation and next study | Test the prototype; do not claim population-wide prevalence |
A literature-review presentation needs a different middle
For a review of remote onboarding research, use four blocks: the question and search scope; the included studies and their settings; where their findings agree or differ; and what the evidence cannot yet answer. Group studies by the question they address instead of assigning one slide to every paper.
For example, one study may measure first-week task completion while another reports employee confidence after three months. Give those outcomes separate columns. They may inform the same decision, but combining them into an “onboarding success rate” would create a measure neither study reported. Close with the specific question a new study or pilot would need to resolve.
Write a finding at the right level of certainty
If four of the six fictional participants mention unclear next steps, say that four interview participants described the issue. Do not turn it into “67% of customers are confused.” The latter implies a population estimate the study design does not support.
A short participant quote can make an experience concrete when you have permission to use it and preserve its meaning. An invented quote should never be used to make a finding feel more authentic. Use a clearly labeled illustrative scenario instead.
A participant who completed setup easily may reveal a condition that explains the difficulty, such as prior experience. Do not remove that case merely because it weakens a simple narrative. It can improve the next research question.
Build a finding slide with three parts
Use a headline, a supporting excerpt or observation, and the implication for the next stage. The implication should remain visibly separate from the evidence. “Test clearer labels” is a proposed response, not a result of the interviews.
For a quantitative example, imagine an internal review of 60 completed cases, with 15 open cases excluded. Eighteen completed cases met a target. A defensible slide says “18 of 60 completed cases met the target (30%)”; its source note identifies the review, reporting period, relevant table and exclusion. A final references slide alone does not tell a reader which source supports which number.
On a crowded slide, use a short source label and table/page reference next to the chart, with the full retrievable reference in notes or a references slide. Keep the exclusion visible on the main slide because it changes the denominator. If two sources disagree, record their populations and time windows before treating the difference as a trend.
| Claim type | Example | Review action |
|---|---|---|
| Finding | 18/60 completed cases = 30% | Keep the denominator in the title or chart label |
| Unsupported headline | Only 30% of all cases met the target | Correct the scope; open cases were excluded |
| Recommendation | Investigate the causes before changing the process | The count alone does not establish a cause |
- Observation
Several participants paused at the same setup choice.
- Interpretation
The label may not communicate the distinction they need.
- Proposed next step
Test a revised label in a prototype.
- Boundary
The interviews do not establish how common the issue is across all users.
Build a compact source ledger
For each candidate claim, record the original source, date, relevant passage and limitation. This prevents a polished summary from becoming the only surviving evidence.
Check whether several articles are repeating the same underlying source. Ten links do not constitute ten independent pieces of evidence when they all lead back to one press release or study.
| Claim type | Source to seek | Boundary to preserve |
|---|---|---|
| Product feature | Current official documentation | Plan, interface and availability |
| Measured outcome | Original report or dataset | Period, population and method |
| Customer experience | Approved interview or feedback record | Who said it and what it can represent |
| Recommendation | Your reasoning from the evidence | Assumptions and alternatives |
- “Completion rose to 60%”: Find the numerator, denominator and period. Keep only with those definitions.
- “The change caused the improvement”: Look for evidence of causation, not just timing. Weaken or remove if unsupported.
- “The tool exports editable PPTX”: Check current official product documentation and plan. State the relevant qualification.
- “Customers prefer this option”: Inspect who was asked and how. Use the sample-specific finding if that is all the evidence supports.
Resolve conflicts before writing a confident headline
Two sources can disagree because they measure different things, cover different periods or use different definitions. Compare those conditions before deciding one source is wrong. If the disagreement remains unresolved, present it as an open question.
A synthesis should explain the relationship between sources, not merely stack summaries. For example, a survey might identify a reported difficulty while a usage log shows where the process slows down. Together they can motivate a pilot without proving the cause.
Research and presentation creation in Syaxis: where each step belongs
Syaxis turns a research question or source packet into a complete presentation through built-in research, writing and slide design. Start directly in Presentations, review the finished deck, request revisions beside the slides and export to PowerPoint, PDF or PNG. For this interview example, supply the approved summaries, the audience and the decision. State that external context must remain separate from interview findings.
You do not need a separate research session or an approved outline before starting. If you prefer to explore the question first, use Chat and request a presentation from that same conversation. That request can use its discussion and attached material. For a presentation started elsewhere, attach the selected sources again. Research is built into deck creation, not a separate Research surface.
The source ledger in this guide is a record you maintain, not an automatic per-slide citation feature. Preserve the source title, date, location and the claim it supports. When a new source changes a conclusion, revise both the finding and any summary that repeats it, then check the exported file.
“Create an eight-slide presentation from these approved interview summaries. State the research question and method before the findings. Report participant counts without treating them as population estimates. Include one contrasting case, separate implications from observations and end with limitations and the next research question.”
Recalculate the important numbers
If a slide says a measure rose from 40 to 50, the absolute increase is 10 and the relative increase is 25% from the original value. A change from 40% to 50% is 10 percentage points, although it is also a 25% relative increase. These descriptions are not interchangeable.
Check the direction of the denominator and the reporting period. A chart that mixes monthly and quarterly figures can look coherent while supporting no valid comparison. If the source data is missing, do not repair the story by guessing.
Check what visuals imply
A generated image of a new facility can be an honest concept illustration if labeled appropriately. It should not appear to document a completed site. A generated chart-like picture should not substitute for a chart built from verified numbers.
Inspect captions, axis labels and crop choices. A truthful dataset can still be presented misleadingly if the visual removes a relevant baseline or hides an exception. Use presentation visuals to choose the right form for the evidence.
Review the final claim, not just the citation
Open the source behind each major headline. Check whether the headline has broadened the population, strengthened certainty or changed a comparison into a causal explanation. A citation beside an unsupported sentence does not make the sentence supported.
After export, inspect whether the important qualifications remain accessible in the file. For a detailed review process, see verifying AI presentation sources. If you need help choosing a research starting point, use AI research tools.
In Syaxis, request a specific change: “Replace the population-wide claim on slide three with the sample-specific finding, and preserve the source period.” Review the revised slide and any summary that repeats the claim.
How this example was made and checked
The initial brief and setup choices are shown above. One short follow-up clarified that 2023 is the Copilot paper year, not the experiment year. The exact brief, follow-up request and source notes distinguish study findings from the proposed pilot.
The sources include the Noy and Zhang writing experiment, the published 2025 customer-support study, the GitHub Copilot paper and the METR early-2025 developer study. Their tasks, populations and measures differ; the coding studies are not a head-to-head product comparison.
All eight slides and the PowerPoint export rendered in LibreOffice were visually checked. Interactive Microsoft PowerPoint editing was not tested. This demonstration is not a first-pass accuracy benchmark.
FAQ
Should limitations be saved for the final slide?
A final limitations slide can help, but important qualifications should also sit beside the findings they affect. Otherwise the audience may remember an overstated claim before reaching the caveat.
Can I use percentages for a small interview sample?
Counts are often clearer for this kind of example. If you use a percentage, state the sample and avoid implying it estimates the whole population.
Should I generate the deck before checking the research?
A draft can expose missing questions, but do not treat it as ready to share until the important claims have been checked. Verification is easier when the source ledger survives the drafting process.
What if the sources do not support a recommendation?
Present the uncertainty and propose the next evidence-gathering step. A clear account of what remains unknown can be more useful than an unsupported recommendation.
Is a source link enough to verify a slide?
No. The linked source must support the exact claim and its scope. Locate the relevant passage or table and check the interpretation.
Can another AI verify the deck for me?
It can help identify issues or locate evidence, but agreement between models is not proof. An accountable reader still needs to inspect important claims against their sources.
How do I cite a source on a crowded slide?
Put a concise source label and page or table location beside the relevant claim. Keep qualifications that affect interpretation visible. Supply the full source reference in notes or a references slide so the reader can retrieve it.
Bring it into your work.
Draft the key finding and its limitation together before choosing a presentation visual.
If you need to document one project before presenting it, use the case study template and worked example to connect each claim to its evidence.
How we prepare our guides
Syaxis uses AI to assist with drafting and translation. Comparisons draw on linked sources; they are not hands-on tests unless a test method is described. Worked examples are illustrative unless identified otherwise.


